Journal of Fluid Flow, Heat and Mass Transfer (JFFHMT)
ISSN: 2368-6111

Volume 12 - Year 2025 - Pages 327-342
DOI: 10.11159/jffhmt.2025.032
CFD application in slurry transport through Annular Jet Pump -A Mixture Model Approach
Sadia Riaz, Jussi Aaltonen, and Kari Koskinen
Mechatronics Research Group (MRG), Unit of Automation Technology and Mechanical Engineering,
Faculty of Engineering and Natural Sciences, Tampere University, Korkeakoulunkatu 7, 33720 Tampere, Finland.
sadia.riaz@tuni.fi; jussi.aaltonen@tuni.fi; kari.koskinen@tuni.fi
Corresponding author email: sadia.riaz@tuni.fi
Abstract - The transport of slurry plays a critical role in determining the efficiency, cost, and sustainability of large-scale mining operations. Annular Jet Pumps (AJPs), owing to their simple geometry, absence of moving parts, and low maintenance demands, represent a promising alternative to conventional pumping systems. This study presents a detailed numerical investigation of sand–water slurry flow in an AJP using the mixture model within a CFD framework. The Realizable k–ε turbulence model is incorporated to capture the multiphase turbulence characteristics, enabling accurate prediction of particle–fluid interactions and energy dissipation mechanisms. A comprehensive parametric analysis is conducted to assess the influence of dispersed-phase particle size, solid volume fraction, and geometric parameters, including nozzle radius and convergence angle, on suction performance, pressure recovery, and specific energy consumption (SEC). The results indicate that careful optimization of operating and geometric parameters can substantially enhance suction capacity while minimizing SEC, thereby improving the overall energy efficiency of the system. Model predictions are validated against established experimental and numerical benchmarks from the literature, showing strong agreement and confirming the reliability of the adopted methodology. The outcomes of this work underscore the potential of modular AJPs as sustainable, energy-efficient solutions for slurry transport in mining, with broader implications for reducing environmental footprint and operational costs.
Keywords: Slurry Transport, Mixture model Apporach, Trubulent Kinetic Enegry, Turbulent Dissipation Rate, Turbulent Dynamic Viscosity
© Copyright 2025 Authors - This is an Open Access article published under the Creative Commons Attribution License terms Creative Commons Attribution License terms. Unrestricted use, distribution, and reproduction in any medium are permitted, provided the original work is properly cited.
Date Received: 2025-01-03
Date Revised: 2025-08-19
Date Accepted: 2025-09-04
Date Published: 2025-10-02
Nomenclature
| Q | Primary fluid volumetric flow rate (m³/h) |
| LC | Length of converging section of the nozzle (mm) |
| LT | Length of the nozzle throat (mm) |
| LD | Length of a diverging section of the nozzle (mm) |
| rT | Throat radius of the nozzle (mm) |
| ri | Inlet radius of the nozzle (mm) |
| ro | Outlet radius of the nozzle (mm) |
| α | Converging angle of the nozzle (degree) |
| β | Diverging angle of the nozzle (degree) |
| Dp | Dispersed particle size (mm) |
| μ | Dynamic viscosity (Pa·s) |
| μt | Turbulent viscosity (m²/s) |
| k | Turbulence kinetic energy (m²·s⁻²) |
| ε | Turbulent dissipation rate (m²·s⁻³) |
| S | Strain rate magnitude (s⁻¹) |
| σk | Turbulent Prandtl number for k (--) |
| σε | Turbulent Prandtl number for ε (--) |
| Sk , Sε | User-defined source terms (m²·s⁻³) |
| Ωij | Mean rate-of-rotation tensor (s⁻¹) |
| AP | Cross-sectional area for primary flow (mm²) |
| AS | Cross-sectional area for secondary flow (mm²) |
| j | Volume-averaged mixture velocity (m/s) |
| uc | Continuous phase velocity vector (m/s) |
| ud | Dispersed phase velocity vector(s) (m/s) |
| ρ | Mixture density (kg/m³) |
| ρc | Continuous phase density (kg/m³) |
| ρd | Dispersed phase density (kg/m³) |
| p | Pressure (Pa) |
| Dmd | Turbulent dispersion coefficient (m²/s) |
| mdc | Mass transfer rate from dispersed to continuous phase (m³·s⁻¹) |
| g | Gravity vector (m/s²) |
| F | Additional volume force (N/m³) |
| uslip | Slip velocity vector between two phases (m/s) |
| jslip | Slip flux (m/s) |
| τGm | Sum of viscous and turbulent stresses (kg/(m·s²)) |
| Cd | Particle drag coefficient (--) |
| ReP | Particle Reynolds number (--) |
| ∅c | Volume fraction of the continuous phase (--) |
| ∅d | Volume fraction of the dispersed phase (--) |
| ∅max | Maximum packing volume fraction of the particles (--) |
| μc | Dynamic viscosity of the continuous phase (Pa·s) |
1. Introduction
The efficient transport of solid–liquid mixtures is a central challenge in mining, dredging, and process industries, where the movement of mineral slurries directly influences energy consumption, productivity, and operational sustainability. Conventional slurry pumps, while widely used, are often associated with high maintenance costs, wear due to solid–liquid interactions, and reduced reliability under abrasive flow conditions. In this context, jet-assisted pumping technologies, and particularly AJPs, have emerged as attractive alternatives due to their simple construction, absence of moving parts, and inherent capability to handle multiphase flows with reduced mechanical wear.
AJPs operate on the principle of momentum transfer from a high-pressure primary fluid to a secondary slurry stream, enabling efficient entrainment and transport of solid particles. Previous studies have demonstrated their potential in mining and dredging applications, with particular emphasis on suction performance and operational reliability. However, despite these advantages, the hydraulic efficiency of AJPs is often limited by multiphase flow complexities such as turbulence modulation, particle–fluid slip, and pressure recovery losses. The optimization of operating conditions and AJP geometry is therefore critical to improving the energy efficiency of slurry transport, especially when targeting reductions in Specific Energy Consumption (SEC), which remains a key performance indicator in sustainable mining operations.
Computational Fluid Dynamics (CFD) has become an indispensable tool in resolving the intricate physics of multiphase flows within AJPs. Among available numerical approaches, the mixture model offers a robust framework by accounting for interphase momentum exchange and particle–fluid slip while maintaining computational efficiency. When coupled with turbulence closures such as the realizable k–ε model, it enables detailed characterization of turbulence structures, pressure distribution, and particle dynamics across pump components. While existing studies have addressed the general performance of AJPs, systematic investigations that integrate multiphase flow physics, turbulence characterization, and energy efficiency metrics such as SEC remain limited.
The present work addresses this gap by numerically investigating the slurry transport performance of an AJP using a mixture model approach. A parametric analysis is conducted to evaluate the effects of particle size, solid volume fraction, nozzle radius, and convergence angle on suction behavior, pressure recovery, and SEC. Model predictions are validated against established experimental and numerical benchmarks from the literature, ensuring reliability of the methodology. The findings provide new insights into optimizing AJP performance for sand–water slurry transport, highlighting the potential of modular AJPs as sustainable and energy-efficient pumping solutions in mining applications.
2. Related Work
Due to the complex interactions between solid particles and the carrier fluid, efficient sand-water slurry transport is crucial in industries like mining, dredging, and petroleum. AJPs are favored for transporting multiphase mixtures without mechanical parts, reducing maintenance costs. However, optimizing AJPs for slurry transport requires understanding parameters like particle size, concentration, rheology, and geometrical features (e.g., throat dimensions, nozzle angles). Key flow characteristics, including velocity profiles, pressure distribution, and phase mixing efficiency, are vital for reliable performance. [1].
CFD models, including Eulerian-Lagrangian, Eulerian-Eulerian, and mixture models, are essential for studying slurry flows. The Eulerian-Lagrangian model offers detailed particle-scale insights but is computationally intensive for high particle concentrations. The Eulerian-Eulerian model handles dense flows efficiently but lacks particle-level detail. The mixture model balances the slurry as a single continuum with averaged properties, which is ideal for well-mixed phases and less critical particle-fluid interactions. [2]. Extensive research has been conducted on slurry transport systems, including their integration into jet pumps. Jet pumps are broadly classified into Centre Jet Pumps (CJPs) and Annular Jet Pumps (AJPs), with literature indicating that AJPs offer higher efficiency. However, significant opportunities remain to enhance the design and performance of AJPs.
Shimizu [3] demonstrated that AJPs can achieve efficiencies up to 36%, comparable to CJPs, and highlighted the impact of swirl on performance. Kökpinar & Gögus [4] optimized water jet pumps for slurry transport, achieving 33% efficiency and introducing a bypass system to reduce wear on centrifugal pumps. Xinping Long and his team at Wuhan University have extensively studied slurry transport through AJPs over the past two decades. They investigated cavitation initiation and development under varying flow rate ratios and optimized AJP design using Design of Experiments (DOE), CFD, and experiments. They analyzed cavitation in jet pumps with different area ratios. They employed Large Eddy Simulations (LES) to study flow characteristics and turbulent coherent structures [5], revealing vortex behavior in recirculation regions and boundary layers. Later, they examined cavity-length pulsation characteristics in jet pumps [6] and cavitation behavior under negative flow ratios [7], providing insights into pressure ratio effects on cavitation areas and enhancing AJP design and performance understanding.
Singh et al. [8] employed CFD to study slurry flow, comparing their two-phase mixture model, incorporating algebraic slip and turbulent dispersion, with the models proposed by Kaushal et al. [9], in 2012. Their model demonstrated accurate pressure drop predictions, challenging earlier results despite variations in solids concentration profiles. They emphasized the model's simplicity and suitability for engineering applications, highlighting its potential for pressure drop prediction. They also called for further research to enhance solids concentration profile accuracy in slurry flow pipelines.
Messa [2] conducted a comprehensive review of CFD methods for slurry transport, including the Eulerian-Eulerian, Eulerian-Lagrangian, and Mixture models, emphasizing the mixture model's versatility across diverse solid volume fractions. Over the past decade, Messa and Matoušek [10],[11] advanced research on pipeline slurry transport using CFD and experiments. They employed the β-σ two-fluid model [12] , an extension of the Eulerian approach to study horizontal pipe flows under various conditions, such as differing solid sizes and slurry types. Kai et al. [13] studied multi-nozzle AJPs using CFD simulations, focusing on nozzle geometry and pump performance. Their work, validated experimentally, also optimized AJPs using the Kriging model [14] with CFD and experimental data. Wang et al. [15] introduced the Streamlined AJP to improve flow smoothness and minimize energy loss in the Early AJP, using the realizable k-epsilon and Schnerr-Sauer cavitation models in separate simulations for both pump types.
Tanoj et al. [16] developed a 3D model employing the Eulerian–Eulerian RNG k-ε approach to investigate the transport of silica sand and fly ash slurries under varying Prandtl numbers. A sand-to-fly ash ratio of 65:35 combined with a low-viscosity fluid (Pr = 2.88) was found to minimize pressure gradients and energy consumption, whereas a 95:05 mixture delivered the highest heat transfer coefficient at elevated Reynolds numbers and efflux concentrations. The study emphasizes the significant role of slurry composition and Prandtl numbers in enhancing transport efficiency and thermal performance. In a separate study, the same authors [17] used a 3D Eulerian RNG k-ε turbulence model to analyze energy-efficient slurry transport involving bottom ash and silica sand. The results revealed that bottom ash required the least energy for transport, while silica sand demanded the most, with greater deviations observed for larger particle sizes, higher concentrations, and increased flow velocities. These findings, validated by experimental data, provide valuable insights into optimizing slurry transport systems for industrial applications. In a recent computational study, he [18] have explored the flow and thermal behavior of mono- and bi-modal slurries in pipelines, comparing them with water flow under varying Re and concentrations. A 3D model showed that a 65:35 silica sand, fly ash mixture achieved the lowest pressure drop and specific energy consumption, enhancing transport efficiency. Wall shear stress and energy are increased with Re and slurry concentration, while the 100% silica slurry exhibited the highest heat transfer performance. This highlights the significance of slurry composition in optimizing energy and flow dynamics. They also studied [19] a 3D CFD model to analyze the transport and thermal behavior of bi-modal silica sand–fly ash slurries flowing through a 90° horizontal pipe bend. Using an Eulerian–Eulerian RNG k-ε model with the kinetic theory of granular flow, the effects of particle composition, efflux concentration, Prandtl number, and flow velocity are investigated. Results indicate that the 65:35 mixture minimizes pressure drop, while the 100:0 mixture maximizes heat transfer performance. The analysis also evaluates bend loss coefficients, concentration distribution, convective heat transfer, and the Nusselt number for varying slurry conditions.
This study employs a multiphase mixture model to simulate the complex interactions between solid particles and the carrier fluid within an AJP. The objective is to develop a robust and efficient AJP design tailored for sand and water slurry transport, addressing challenges posed by multiphase flow dynamics and providing practical solutions for industrial applications, particularly in mining and mineral processing. In this research, a mixture model [20] with realizable k-ɛ is employed to study the slurry flow in AJP to optimize its SEC. A detailed parametric study shows the effect of the primary fluid`s volumetric flow, convergence angle, throat diameter, sand particle size, and volume fraction. These parameters can improve the suction pressure of the AJP, and consequently, the SEC will be reduced, which is the focus of this paper.
Sadia et al. [21] recently examined the structural factors influencing suction performance in AJPs, focusing on the primary fluid’s flow rate, convergence angle, and throat diameter. Numerical simulations using the realizable k-ε turbulence model were validated experimentally, showing strong agreement with a mean absolute error (MAE) of 1.71 kPa and a root mean square error (RMSE) of 2.02 kPa. Optimizing the convergence angle (27°) and throat diameter (10 mm) enhanced suction capacity at a flow rate of 10 m³/h. These results confirm the model's reliability and the AJP's suitability for energy-efficient industrial applications. They also studied Specific Energy Consumption optimization for AJP using mixture model. Same researcher [22] studied AJP geometric design for slurry transport major and testing of the full-scale prototype has been executed in an opencast oil-shale mine under (partly) submerged conditions. During the field tests, the working principle of the Venturi ore transport system could be proven by successful transport of excavated oil-shale up to a certain grain size. In a related study, Berners et al. [22] explored the optimization of specific energy consumption in AJPs using the Mixture Model. Additionally, they examined the geometric design of AJPs for slurry transport and conducted full-scale prototype testing in an opencast oil-shale mine under partially submerged conditions. Field tests successfully demonstrated the working principle of the Venturi-based ore transport system, effectively transporting excavated oil shale up to a certain grain size, confirming the practical feasibility of the AJP system in real-world mining applications.
As this study is a step towards efficient mining, the reduced energy consumption plays a crucial role in utilizing AJP in mineral extraction. This work is compared with research by [14] for the AJP modeling. The results are also benchmarked against the numerical analysis of Singh et al. [8], as well as the combined numerical simulations and experimental investigations carried out by Kaushal [9]. The validation of the results demonstrates that this model is highly suitable for simulating slurry flow through AJPs, as it balances computational efficiency and accuracy, making it a preferred choice for practical applications. The existing literature primarily uses efficiency as the sole metric for evaluating system effectiveness. However, this article expands on this by conducting a parametric study on design variables and presenting results for reduced SEC. This metric has not been previously addressed in the literature.
3. Computational Model
An AJP consists of three key components which include the converging nozzle, the diverging nozzle, and the throat. In the converging section, the primary fluid (water) creates an annulus, generating a vacuum at the throat to suction the secondary fluid (slurry). The AJP in this study is modular, allowing for interchangeable nozzle designs with a single core, as shown in Figure 1[21]. Pressure is measured at four critical points which include the primary and secondary fluid inlets, the throat, and the diffuser. Key geometric parameters, such as throat length, diameter, and convergence angle, are critical for pump efficiency, affecting mixing, friction, and vacuum generation. The volumetric flow rate of the primary fluid also influences slurry suction. The AJP is 3D printed for physical testing, supporting material optimization by fabricating only the nozzle for different designs.
Table I: Mixture Model Equations [20],[23]


Table I presents the expression for mixture density as defined in Equation (1), where and represent the volume fractions of the continuous and dispersed phases, respectively. Here, and are the constant densities of the continuous and dispersed phases (units: kg/m³), as assumed in the Mixture Model formulation. Based on this assumption, the continuity equation is reformulated from Equation (2) as shown in Equation (3). The momentum conservation for the mixture is given by Equation (4), where j is the velocity vector (m/s), ρ denotes density (kg/m³), and p represents pressure (Pa). The reduced density difference ε (kg/kg) is shown in Equation (5), turbulent dispersion coefficient (m²/s), mass transfer rate (kg/(m³·s)) from dispersed to continuous phase, gravitational acceleration g (m/s²), and additional body forces F (N/m³) are also considered, and detail can be found in [23] . The slip velocity (m/s), slip flux (m/s), and total stress tensor (kg/(m·s²)) in Equation (6) encompassing both viscous and turbulent contributions are also incorporated. The transport equation for , the dispersed phase volume fraction is shown in Equation (7). Equation (8) defines the slip flux in terms of , the relative velocity between the two phases. For more comprehensive formulation details, see [23]. To estimate , the Schiller-Naumann model is implemented, as expressed in Equation (9), with the drag coefficient (dimensionless) defined in Equation (10).
The slip velocity between the dispersed and continuous phases is estimated using the Schiller–Naumann drag law, which expresses the drag coefficient as a function of the particle Reynolds number . This formulation is directly integrated into the mixture momentum equation and slip flux term, linking particle-fluid interaction forces to macroscopic velocity fields. The model assumes spherical, monodispersed particles and Newtonian carrier fluid behavior. While these assumptions are supported by good agreement with experimental benchmarks for volume fractions up to =0.5, they may underestimate energy losses and overpredict slip velocity in highly concentrated or polydisperse slurries. In such cases, non-Newtonian effects (e.g., shear-thinning or yield stress behavior) and non-spherical particle drag corrections could become significant. Acknowledging these limitations ensures that the present formulation is applied within its validated operational range, while indicating where extensions could further improve predictive fidelity for denser or more complex slurry systems.
This formulation balances viscous and buoyant forces acting on dispersed particles. Turbulence effects are captured using the realizable k-ε model, which refines the standard k-ε approach by improving predictions in cases like round jets, where the standard version tends to overestimate spread rates. This model maintains consistency with realizability conditions and introduces transport equations for two key turbulence variables: the turbulent kinetic energy k and dissipation rate ε. The equation governing k matches the standard formulation, with its production term provided in Equation (11), and further clarified in Equation (12) whereas Equation (13) details the transport of ε. In the present study, two forms of viscosity are considered within the momentum and turbulence formulations.
The dynamic viscosity (μ) represents the molecular viscosity of the continuous phase and is treated as constant for water in the Newtonian approximation. It characterizes the fluid's intrinsic resistance to deformation due to molecular interactions. The turbulent dynamic viscosity , also referred to as the turbulent eddy viscosity, is introduced by the turbulence model (Realizable k–ε) to account for the enhanced momentum transport due to turbulent eddies. It is computed based on the turbulent kinetic energy (k) and dissipation rate (ε) as shown in equation (14). Turbulent viscosity is defined in Equation (15), where the empirical constant is no longer treated as fixed, as elaborated in Equations (16), (17), and (18). Here, and refer to the mean strain rate and rotation rate tensors, respectively. Default model constants include Cε2 = 1.9, A0 = 4, σk = 1, σε = 1.2. The mixture's dynamic viscosity μ is determined through a correlation dependent on the dispersed phase volume fraction , the maximum packing limit (approximately 0.62 for solids), and the base fluid viscosity . This relation is presented in Equation (19). The dimensionless correction factor is taken as 1 for solid suspensions in this study. The following table III shows the key model coefficients for current model.
4. Results and Analysis
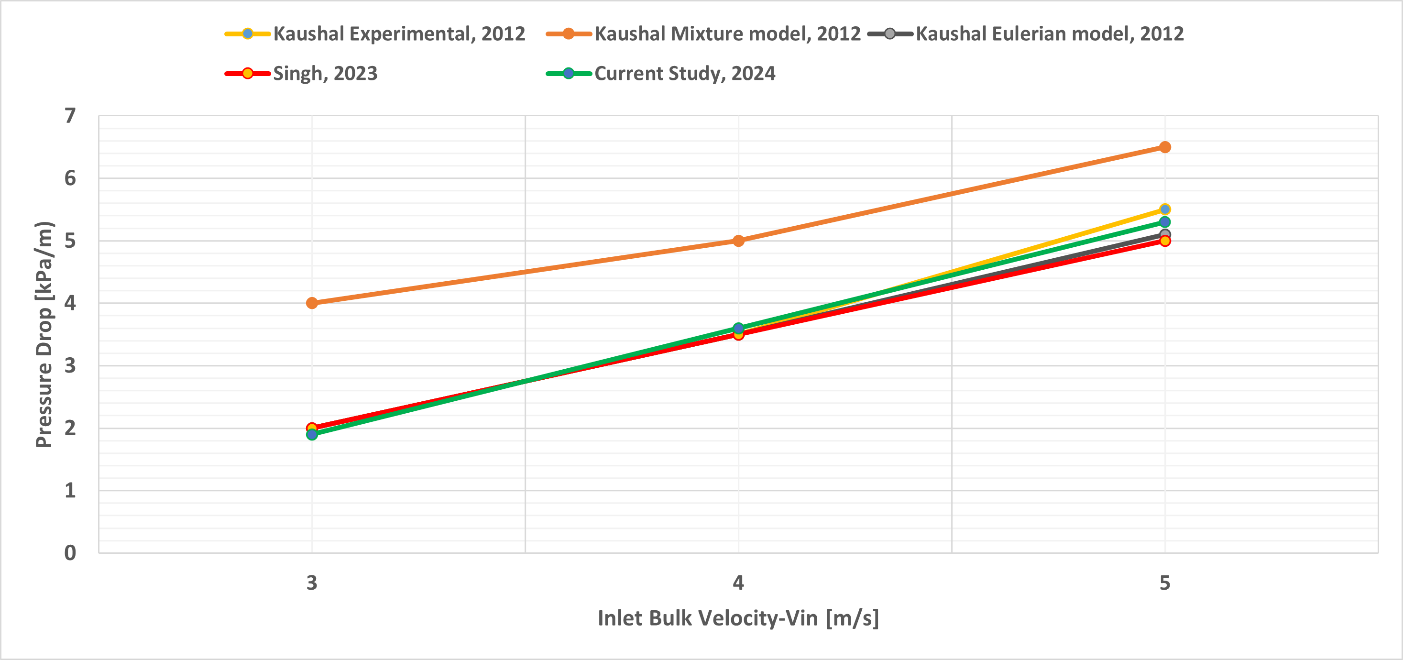
This section demonstrates the result and analysis section for the proposed mixture model coupled with realizable k-ε turbulence model. Figure 2 validates the model developed in this study by comparing the predicted pressure drop per unit length (kPa/m) with inlet bulk velocity (Vin-m/s) against benchmark data from previous literature, including Kaushal's experimental and numerical models (2012) and Singh's numerical model (2023). Kaushal's experimental data (blue line) demonstrates a linear increase in pressure drop with inlet velocity, attributed to heightened viscous and inertial effects. The orange line, representing Kaushal's mixture model, slightly overpredicts the pressure drops, indicating an overestimation of particle-fluid interaction resistance. Kaushal's Eulerian model (grey line) aligns well with experimental results at lower velocities but diverges at higher velocities, revealing limitations in capturing turbulence at elevated flow rates. Singh's model (yellow line) closely follows Kaushal's experimental and mixture model trends, affirming its reliability in predicting slurry flow behavior. The current study's model (dark blue line) exhibits excellent agreement with Kaushal's experimental data and Singh's model across the entire velocity range. This consistency validates the accuracy and robustness of the model in capturing key physical phenomena, including turbulence, particle-fluid interactions, and wall shear effects. These results confirm the reliability of the proposed model as a valuable tool for designing and optimizing AJP systems for efficient slurry transport.
This section presents the result and analysis of the mixture model for the slurry flow in AJP. Here, water is the primary fluid, which provides the volumetric flow rate (Q) for the suction of slurry (sand and water), which is the secondary fluid. Table 2 shows the simulation parameters that are used to conduct this simulation:
Table II: Simulation Parameters
|
Simulation Parameter |
Value |
|
Maximum Flow Capacity (Q) |
10 m3/h |
|
Throat radius of nozzle (rT) |
10 mm |
|
Inlet radius of nozzle (rI) |
14 mm |
|
Outlet radius of nozzle (rO) |
25.5 mm |
|
Convergence angle of nozzle (α) |
27° |
|
Divergence radius of nozzle (β) |
7° |
|
Length of nozzle throat (LT) |
65 mm |
|
AJPs total length |
300 mm |
|
Density of continuous phase |
1000 kg/m3 |
|
Density of dispersed phase |
2600 kg/m3 |
|
Viscosity of continuous phase |
0.001 Pa·s |
|
Dispersed phase volume fraction |
0.2 |
|
Maximum packing concentration |
0.62 |
|
Average concentration |
0.35 |
|
Particle diameter (Dp) |
0.3 mm |
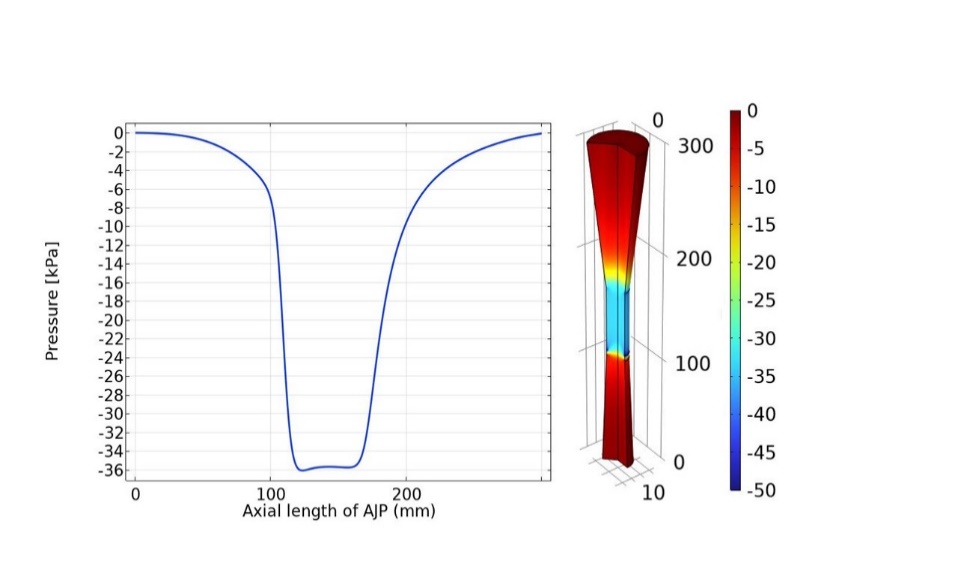
Figure 3 provides a comprehensive analysis of the pressure distribution along the axial length of an AJP using a 1D pressure graph and an axis-symmetric plot. The 1D graph illustrates a sharp pressure drop from the inlet, reaching a minimum at the throat and gradually recovering towards the outlet. This behavior, characteristic of jet pumps, results from fluid acceleration in the nozzle (causing low pressure) and deceleration in the diffuser (facilitating pressure recovery). The axis-symmetric plot complements this by visualizing the spatial pressure distribution, with the throat exhibiting the lowest pressure zones essential for entraining the secondary slurry flow. The gradual pressure recovery downstream ensures proper discharge dynamics. These insights are crucial for optimizing AJP design for efficient slurry transport.
The parametric study of the AJP shown in figure 4 highlights the flow rate, convergence angle, sand volume fraction, and particle size effects on axial pressure distribution. As shown in Figure 4(a), increasing the flow rate causes a more significant pressure drop at the throat due to the Venturi effect, with partial recovery in the diffuser. Figure 4(b) illustrates that larger convergence angles amplify the pressure drop at the throat and enhance recovery efficiency through stronger fluid acceleration and deceleration. In Figure 4(c), higher sand volume fractions lead to more significant pressure drops and reduced recovery efficiency due to increased drag forces and turbulence, disrupting flow stabilization. Lastly, Figure 4(d) demonstrates that bigger particle size tends to increase the pressure distribution on axial length of AJP, emphasizing that AJP’s geometry and operating conditions primarily dictate performance. These findings showcase the AJP's robustness and adaptability under varying conditions and slurry compositions.
Figure 4 presents the parametric study of axial pressure distribution in the AJP under different operating and geometric conditions. In Figure 4(a), the effect of flow rate is evident i.e. as the primary flow increases from 6 m³/h to 10 m³/h, the throat pressure decreases progressively from approximately –18 kPa to –34 kPa. This trend confirms the influence of the Venturi effect, where higher flow velocities intensify suction. A partial pressure recovery is observed in the diffuser, with the exit pressure rising back to around –5 kPa for all cases, though the magnitude of recovery diminishes at higher flow rates due to elevated energy losses.
Figure 4(b) highlights the impact of convergence angle, where throat pressure decreases from roughly –28 kPa at 21° to about –34 kPa at 27°. Larger angles enhance acceleration and deceleration of the flow, which strengthens suction and improves pressure recovery in the diffuser section. However, beyond 25°, the pressure drop curve indicates diminishing recovery efficiency, suggesting an optimal range for geometric design.
In Figure 4(c), variations in sand volume fraction between 0.1 and 0.5 show that higher concentrations intensify throat pressure losses, dropping from –30 kPa at 0.1 volume fraction to nearly –38 kPa at 0.5. The increase in particle loading leads to elevated drag and turbulence, which not only suppress recovery but also extend the low-pressure region along the diffuser length, indicating higher energy penalties for slurry transport.
Finally, Figure 4(d) examines the role of particle size. Across the studied range (1×10⁻⁶ m to 1×10⁻³ m), the axial pressure distribution remains broadly similar, with throat pressures clustered near –34 kPa. Only marginal differences are observed, as larger particles induce slightly higher-pressure losses in the diffuser due to stronger inertia effects, while smaller particles follow the carrier fluid more closely. This result suggests that, within the tested range, particle size has a relatively minor effect compared to flow rate, volume fraction, and convergence angle.
Overall, the parametric investigation demonstrates that optimizing flow rate and geometric parameters, while controlling slurry concentration, plays a decisive role in reducing throat pressure losses and enhancing diffuser recovery. Particle size, although influential, is secondary in comparison to these dominant factors.
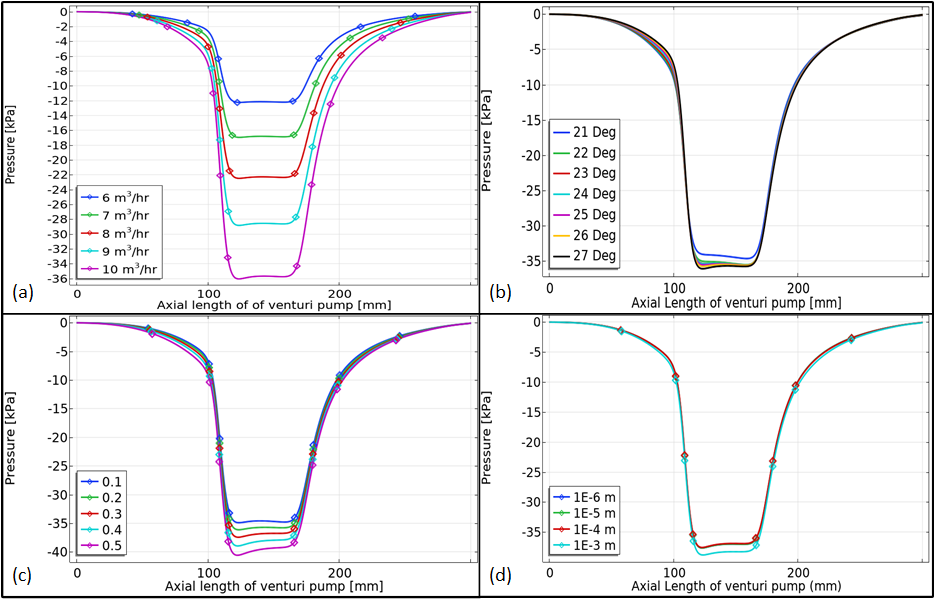
Figure 5 illustrates the variation of Reynolds number along the axial length of the AJP under different operating and design conditions. In Figure 5(a) the Reynolds number distributions are plotted for primary inlet flow rates ranging from 6 m³/h to 10 m³/h. The results show a consistent trend i.e. at the throat region, Reynolds number peaks in the range of 1.0×10⁴ to 1.4×10⁴, compared to inlet values around 3.5×10³ to 6.0×10³. This indicates strong flow acceleration through the nozzle–throat section, driven by jet contraction and shear-layer entrainment. CFD simulation confirms that the increase in flow rate not only shifts the Reynolds number level upward but also sharpens the throat peak, implying stronger turbulence generation and enhanced mixing with the secondary slurry stream. From a slurry transport perspective, such behavior enhances solid suspension capacity, but at the cost of increased wall shear stress and higher specific energy consumption. In Figure 5(b), the diffuser convergence angle (21°–27°) is varied. Increasing the convergence angle systematically reduces the peak Reynolds number at the throat from 1.3×10⁴ (21°) down to 1.0×10⁴ (27°) and also shifts the decay rate downstream. Wider convergence angles promote early boundary-layer growth and local separation, which CFD resolves as attenuated turbulence intensity. For slurry transport, this means that although higher convergence angles may decrease mixing efficiency and re-entrainment of settled particles, they reduce pressure losses and can be beneficial for energy savings in long-distance pumping applications.
Figure 5(c) shows the impact of dispersed-phase volume fraction (0–0.4). As particle concentration increases, the Reynolds number profile is systematically damped, with throat values decreasing from 1.3×10⁴ (=0) to 0.9×10⁴ (=0.4). Numerically, this reduction arises from the Krieger-type viscosity model, where increasing solid concentration elevates effective mixture viscosity, thereby lowering Reynolds number. Physically, higher particle loadings suppress turbulence structures by dissipating kinetic energy, which CFD captures through the modified realizable k–ε turbulence model. From a slurry transport viewpoint, this reflects a trade-off i.e. while higher concentrations reduce turbulence-driven resuspension, they increase mixture density and hydraulic losses, demanding optimization between capacity and efficiency.
Figure 5(d) examines particle diameter effects (Dp = 2×10⁻⁴ m to 1×10⁻³ m). The Reynolds number peaks remain nearly constant (9.0×10⁵–9.5×10⁵), with only slight reductions for larger particle diameters. Numerically, this insensitivity stems from the slip velocity closure i.e. at the given flow conditions, inertial contributions of larger particles alter local momentum transfer only marginally, so mixture viscosity remains dominated by concentration effects rather than particle size. From a slurry transport perspective, this indicates that within the tested diameter range, transport performance is primarily governed by volumetric concentration rather than particle size, though coarser particles may exacerbate wear and erosion at the throat and diffuser walls.
Overall, Figure 5 highlights the coupled effects of hydrodynamic design (inlet flow rate and diffuser angle) and slurry properties (volume fraction and particle diameter) on Reynolds number evolution inside AJPs. From the CFD standpoint, the simulations validate that turbulence modulation and effective viscosity are the dominant mechanisms shaping flow characteristics. From the slurry transport viewpoint, these findings emphasize the operational trade-offs between maximizing suction capacity, controlling turbulence intensity, and minimizing energy penalties in practical applications.
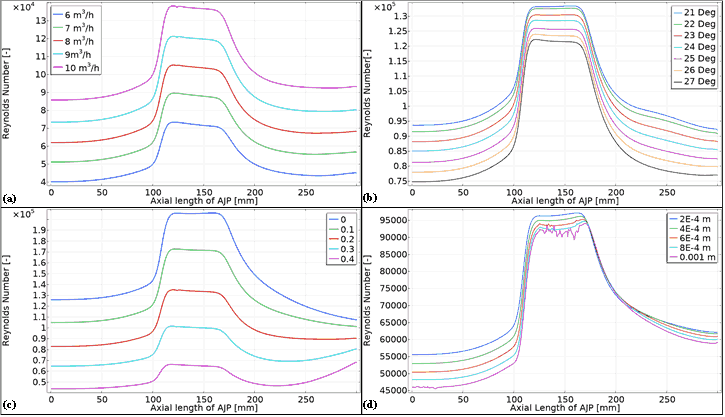
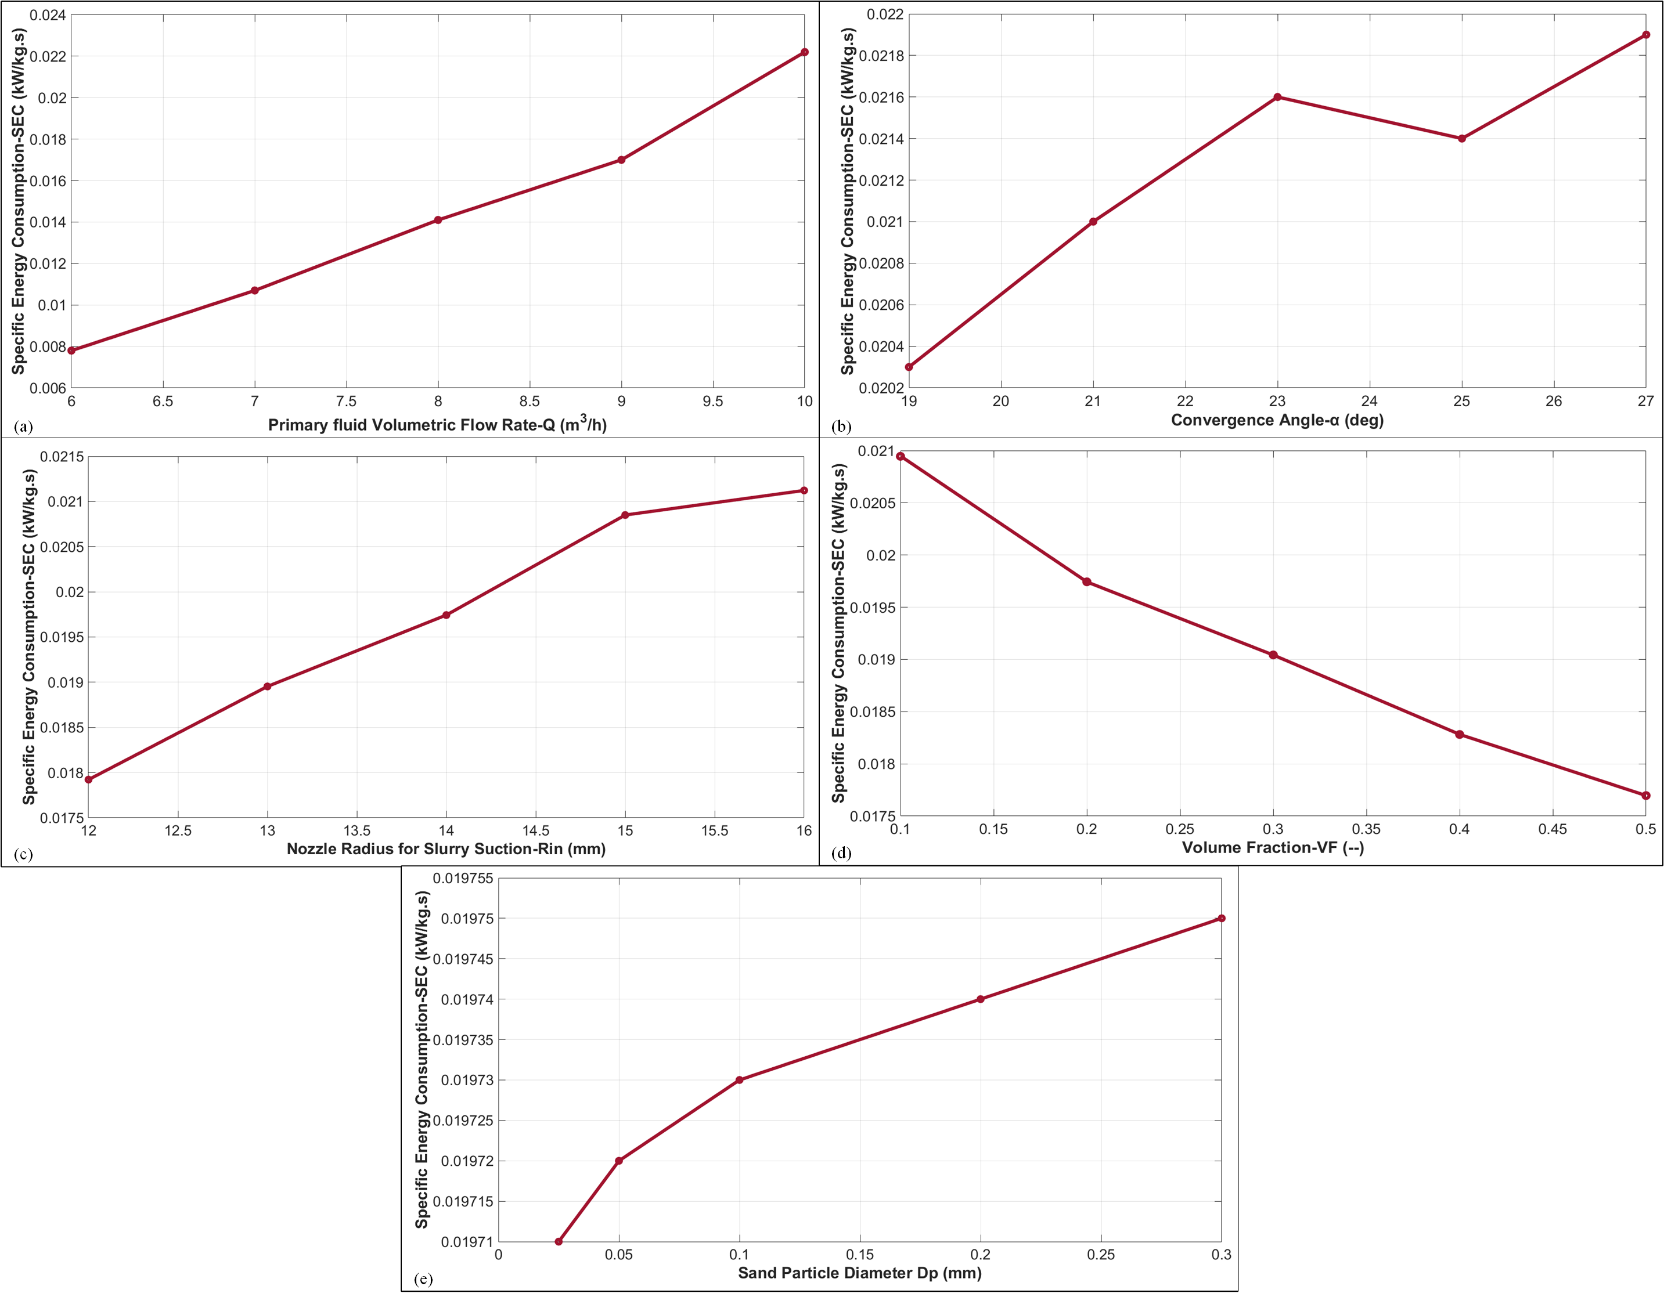
Figure 6 analyses the variation in SEC for an AJP handling a sand-water slurry influenced by operational and geometric parameters. In Figure 6(a), SEC increases with the primary fluid’s volumetric flow rate (Q), reflecting higher energy demands due to enhanced viscous losses and momentum exchange. Figure 6(b) shows that SEC decreases with smaller convergence angles (α) due to efficient mixing but rises sharply beyond an optimal angle due to turbulence and flow separation. In Figure 56c), SEC increases as the suction nozzle radius (Rin) grows, driven by greater entrained slurry volume, enhanced turbulence, and drag forces. Figure 6(d) highlights a decrease in SEC with increasing sand volume fraction (VF) from 0.1 to 0.5, attributed to improved energy transfer efficiency, though excessive concentrations could pose challenges. Finally, Figure 6(e) demonstrates a steady rise in SEC with increasing sand particle size (Dp), linked to greater drag forces and flow resistance. These results emphasize the interplay of pump design, operational conditions, and slurry properties in optimizing energy efficiency.
Figure 6 presents the influence of operating and design parameters on Specific Energy Consumption (SEC) of the annular jet pump (AJP). In Figure 6(a), SEC shows a strong dependence on the primary fluid flow rate. As the flow rate increases from 6 m³/h to 10 m³/h, SEC rises nearly linearly from 0.016 MW·s/kg to 0.024 MW·s/kg. This indicates that although higher flow rates improve suction performance, they impose a higher energy cost per unit mass of slurry transported. Figure 6(b) highlights the effect of convergence angle (α). Between 19° and 23°, SEC increases from approximately 0.018 to 0.021 MW·s/kg, reflecting enhanced turbulence and pressure losses associated with stronger acceleration and deceleration. Interestingly, SEC decreases slightly at 25° (~0.0205 MW·s/kg) before rising again at 27° (~0.022 MW·s/kg), suggesting an optimal angle near 23–25° where recovery efficiency offsets additional turbulence losses.
In Figure 6(c), the nozzle radius (Rin) significantly influences SEC. Enlarging the radius from 12 mm to 16 mm increases SEC from 0.0175 to 0.0215 MW·s/kg. Larger nozzles require higher energy input to maintain entrainment, thereby reducing energy efficiency despite greater suction capability.
Figure 6(d) shows that slurry concentration plays a contrasting role. Increasing the solid volume fraction from 0.1 to 0.5 leads to a reduction in SEC from ~0.021 to 0.0175 MW·s/kg. This inverse relationship arises because higher solid loading enhances momentum transfer between phases, making transport more energy efficient per unit mass of slurry delivered, even though higher drag forces and turbulence are present. Finally, Figure 6(e) illustrates the effect of particle diameter (Dp), where SEC varies only marginally from 0.019715 to 0.019755 MW·s/kg as Dp increases from 0.01 mm to 0.3 mm. The minor variations confirm that within the tested range, particle size has negligible influence on overall energy consumption compared to flow rate, nozzle radius, and volume fraction.
Taken together, these results emphasize that flow rate and nozzle geometry are the dominant factors controlling SEC, while convergence angle shows an optimal window for efficiency. Slurry concentration improves energy efficiency at higher loadings, whereas particle size exerts only a secondary effect.
5. Conclusion
This study establishes the potential of Annular Jet Pumps (AJPs) as energy-efficient and robust devices for slurry transport in mining and mineral processing applications. Using a CFD-based mixture model coupled with the Realizable k–ε turbulence model, the complex interactions between solid particles and carrier fluid are accurately resolved, enabling detailed assessment of suction capacity, pressure recovery, turbulence modulation, and Specific Energy Consumption (SEC).
The parametric analysis revealed that throat pressure dropped from –18 kPa at 6 m³/h to nearly –34 kPa at 10 m³/h, demonstrating the strong influence of flow rate through the Venturi effect. Similarly, convergence angle variations showed throat pressures reducing from –28 kPa (21°) to –34 kPa (27°), highlighting an optimal range near 23–25° where efficient acceleration and recovery balance turbulence losses. Reynolds number profiles peaked between 1.0×10⁴ and 1.4×10⁴ at the throat, confirming strong turbulence generation that enhances solid suspension but increases wall shear stresses.
From an energy perspective, SEC increased almost linearly with flow rate, rising from 0.016 MW·s/kg at 6 m³/h to 0.024 MW·s/kg at 10 m³/h. However, increasing solid volume fraction from 0.1 to 0.5 reduced SEC from 0.021 MW·s/kg to 0.0175 MW·s/kg, underscoring the role of momentum exchange in improving transport efficiency. Particle size effects were marginal, with SEC varying only between 0.019715 and 0.019755 MW·s/kg for diameters of 0.01–0.3mm, confirming that concentration and geometry dominate over size within the tested range.
Validation against experimental and numerical benchmarks §confirmed the model’s reliability, with mean absolute error values below 2 kPa in pressure gradient prediction. This agreement strengthens confidence in the mixture model’s predictive capacity while maintaining computational efficiency compared to more intensive multiphase approaches.
By systematically addressing SEC optimization, a metric often overlooked in prior AJP studies, this work advances the understanding of energy performance in multiphase jet pumping. The findings highlight that careful tuning of flow rate, convergence angle, and nozzle radius, combined with optimized slurry concentration, can yield substantial energy savings while preserving suction capacity. These insights have direct implications for sustainable mining operations, where reducing energy consumption and minimizing wear can translate into significant cost and environmental benefits.
Future studies should extend this framework to non-Newtonian slurries, broader particle size distributions, and transient operational conditions. Incorporating structural wear modeling, material erosion studies, and advanced control strategies will further bridge the gap between numerical prediction and industrial application. Ultimately, the integration of CFD modeling, design optimization, and experimental validation paves the way for AJPs to emerge as next generation pumping solutions, enabling reliable, cost-effective, and environmentally responsible slurry transport.
References
[1] Elger D F, Taylor Sam J, and Liou C P, "Recirculation in an Annular-Type Jet Pump," J Fluids Eng, pp. 735-740, 1994. View Article
[2] G. V. Messa et al., "Computational fluid dynamics modelling of liquid-solid slurry flows in pipelines: State-of-the-art and future perspectives," Processes, vol. 9, no. 9, Sep. 2021. View Article
[3] S. Nakamura, S. Kuzuhara, and S. K. Teacher, "Yukimaru Shimizu Studies of the Configuration and Performance of Annular Type Jet Pumps," 1987. View Article
[4] M. A. Kökpinar and M. Göğüş, "THE PERFORMANCE OF WATER JET PUMPS AND THEIR APPLICATION IN SLURRY TRANSPORTATION," Isi Bilimi Ve Teknigi Dergisi/ Journal of Thermal Science and Technology, vol. 43, no. 1, pp. 119-134, 2023. View Article
[5] M. Sen Xu, X. L. Yang, X. P. Long, Q. Lyu, and B. Ji, "Numerical investigation of turbulent flow coherent structures in annular jet pumps using the LES method," Sci China Technol Sci, vol. 61, no. 1, pp. 86-97, Jan. 2018. View Article
[6] J. Wang, S. Xu, H. Cheng, B. Ji, J. Zhang, and X. Long, "Experimental investigation of cavity length pulsation characteristics of jet pumps during limited operation stage," Energy, vol. 163, pp. 61-73, Nov. 2018. View Article
[7] X. Long, J. Wang, J. Zhang, and B. Ji, "Experimental investigation of the cavitation characteristics of jet pump cavitation reactors with special emphasis on negative flow ratios," Exp Therm Fluid Sci, vol. 96, pp. 33-42, Sep. 2018. View Article
[8] J. Singh, S. Catsoulis, D. Lakehal, and C. Narayanan, "Predicting pressure-drop for pseudo-homogeneous slurry flows using the mixture model at high solids concentrations," International Journal of Multiphase Flow, vol. 159, Feb. 2023. View Article
[9] D. R. Kaushal, T. Thinglas, Y. Tomita, S. Kuchii, and H. Tsukamoto, "CFD modeling for pipeline flow of fine particles at high concentration," International Journal of Multiphase Flow, vol. 43, pp. 85-100, Jul. 2012. View Article
[10] G. V. Messa and V. Matoušek, "Analysis and discussion of two fluid modelling of pipe flow of fully suspended slurry," Powder Technol, vol. 360, pp. 747-768, Jan. 2020. View Article
[11] G. V. Messa et al., "Computational Fluid Dynamic Modelling of Fully-Suspended Slurry Flows in Horizontal Pipes with Different Solids Concentrations," KONA Powder and Particle Journal, vol. 2023, no. 40, pp. 219-235, 2023. View Article
[12] G. V. Messa, M. Malin, and V. Matoušek, "Parametric study of the β - σ two-fluid model for simulating fully suspended slurry flow: effect of flow conditions," Meccanica, vol. 56, no. 5, pp. 1047-1077, May 2021. View Article
[13] K. Xu et al., "CFD-Based study of nozzle section geometry effects on the performance of an annular multi-nozzle jet pump," Processes, vol. 8, no. 2, Feb. 2020. View Article
[14] K. Xu et al., "Parameter analysis and optimization of annular jet pump based on Kriging model," Applied Sciences (Switzerland), vol. 10, no. 21, pp. 1-16, Nov. 2020. View Article
[15] X. Wang, Y. Chen, M. Li, Y. Xu, B. Wang, and X. Dang, "Numerical study on the working performance of a streamlined annular jet pump," Energies (Basel), vol. 13, no. 17, Sep. 2020. View Article
[16] T. Joshi, O. Parkash, R. K. B. Gallegos, and G. Krishan, "Parametric investigation of slurry transport: Computational insight into the impact of particle composition and Prandtl numbers," Physics of Fluids, vol. 36, no. 2, Feb. 2024. View Article
[17] T. Joshi, O. Parkash, and G. Krishan, "Estimation of energy consumption and transportation characteristics for slurry flow through a horizontal straight pipe using computational fluid dynamics," Physics of Fluids, vol. 35, no. 5, May 2023. View Article
[18] T. Joshi, O. Parkash, R. K. B. Gallegos, and G. Krishan, "Comparative investigation of the energy consumption and heat transfer characteristics of Uni-modal and Bi-modal slurry flow through a straight pipe," Ocean Engineering, vol. 316, p. 119987, Jan. 2025. View Article
[19] T. Joshi, O. Parkash, R. K. B. Gallegos, and G. Krishan, "Computational investigation of transportation and thermal characteristics in a bi-modal slurry flow through a horizontally placed pipe bend," Powder Technol, vol. 442, Jun. 2024. View Article
[20] Mikko. Manninen, Veikko. Taivassalo, and Sirpa. Kallio, "On the mixture model for multiphase flow." Technical Research Centre of Finland, 1996. View Article
[21] S. Riaz, J. Aaltonen, T. Pinkse, and K. Koskinen, "Parametric study of structural influences on suction performance in an Annular Jet Pump-CFD and experimental validation," Journal of Water Process Engineering, vol. 70, p. 107066, Feb. 2025. View Article
[22] M. Berner, T. Pinkse, S. Riaz, J. Aaltonen, and K. Koskinen, "Slurry Transport System of the ROBOMINERS Prototype," Event title11. Kolloquium "Fördertechnik im Bergbau" 2024, vol. 11, no. 1, p. 26, Feb. 2024. View Article
[23] Comsol, "The CFD Module User's Guide," 2020. View Article