Journal of Fluid Flow, Heat and Mass Transfer (JFFHMT)
ISSN: 2368-6111

Volume 12 - Year 2025 - Pages 318-326
DOI: 10.11159/jffhmt.2025.031
Sustainable Energy Use Across the UK’s Northern Powergrid
Dinesh Chacko1, Monika M. Wahi2
1Institute of Electrical and Electronics Engineers, United Kingdom and Ireland Section
21 Albemarle Street, London, United Kingdom, W1S 4BS
dinesh.chacko@ieee.org
2Research and Data Lab
D 48 Nawada Housing Complex Vipin Garden Dwarka Mor, Delhi, India, 10059
research@RADL.online
Abstract - The United Kingdom (UK) aims to achieve net zero greenhouse gas (GHG) emissions by 2050. Hence, the government is promoting use of heat pumps (HPs) in residences, use of domestic solar photovoltaic (PV) panels, and adoption of electric vehicles (EVs). However, critics cite barriers to adopting these strategies, and current adoption patterns and domestic energy consumption (DC) are unclear. This project uses open data on primary substations (PS) in the Northern Powergrid, which serves the UK’s North East. The UK provides a good case study, given its readily available data and the key fact it is undergoing a net zero transition. This paper aims to answer the research questions: 1) In the 2022 data, what were patterns of DC in the Northern Powergrid, and 2) How are DC patterns associated with HP, solar PV, and EV use? Using data from 541 PSs, DC patterns were mapped, and correlation and regression analysis was used to characterise the relationship between number of HPs, solar PV use, number of EVs and DC for the areas served by the PSs. Areas of high DC had higher population and were more affluent. Increasing number of HPs and EVs were statistically significantly associated with higher DC in both correlation (HPs r = 0.8579, EVs r = 0.3246, p < 0.0001) and regression analysis, and higher solar PV use was statistically significantly positively correlated with higher DC (r = 0.6937, p < 0.0001). Residences in more densely-populated and affluent areas are newer and therefore more likely to be suitable for HPs, and EV infrastructure is more likely to be established in these areas. These results support criticisms that the UK’s net zero strategy goals may be unattainable, and that increased government intervention is required in order to prevent exacerbating inequities while pursuing this strategy.
Keywords: Electric vehicles, domestic energy consumption, United Kingdom, heat pumps, solar photovoltaic.
© Copyright 2025 Authors - This is an Open Access article published under the Creative Commons Attribution License terms Creative Commons Attribution License terms. Unrestricted use, distribution, and reproduction in any medium are permitted, provided the original work is properly cited.
Date Received: 2024-12-10
Date Revised: 2025-08-04
Date Accepted: 2025-09-15
Date Published: 2025-09-26
1. Introduction
The United Kingdom (UK) government is promoting several sustainability initiatives to achieve a goal of a future net zero strategy [1], [2]. These initiatives include promoting residential heat pump (HP), residential solar photovoltaic (PV), and electric vehicle (EV) adoption [1]. However, there are current practical challenges to adopting these sustainability practices, and how current use of these practices impacts current domestic energy consumption (DC) remains unknown.
First, UK policy to improve sustainable energy usage will be described, including how HP, solar PV, and EV usage is being promoted and adopted. Next, a project that forecasts future energy usage in the Northern Powergrid, which serves northeastern England, will be presented, which is the source of the data used in this analysis.
1.1. UK Policy to Improve Sustainable Energy Usage
In 2019, the UK became the first Group of Seven (G7) country to enshrine a new commitment into law to reach net zero greenhouse gas (GHG) emissions by 2050 [2]. In 2021, the UK government announced its net zero strategy pursuant to Section 14 of the Climate Change Act 2008 [1]. It set a target to reduce carbon dioxide emissions by 68% from 1990 levels by 2030, and to achieve net zero for carbon emissions by 2050 [1], [3], [4]. However, the goals are not on track to be met, partly because the UK government continues to modify policies aimed at sustainability, such as delaying the ban of new diesel and petrol cars, and adjusting the promotion of HPs [3], [5]. Meeting these goals is greatly dependent upon how the UK government promotes these policies [5].
In order to understand how well policies to promote sustainability are working now, analyses of current data are needed. Daily domestic activities in UK households account for over a quarter of the nation's total energy consumption and carbon dioxide emissions [6]. DC should theoretically be impacted by the widespread adoption of sustainable energy approaches currently promoted through UK policy, such as installing HPs for residential housing energy use reduction [7], using domestic PV (solar) panels to generate energy [8], and using EVs to reduce fossil fuel consumption [1]. Significant challenges would exist in implementing an “all electric” pathway in the UK, where the power system’s capacity and operations from renewable energy sources are needed to decarbonise the current electrical demands [9]. An all electric pathway would also potentially add large-scale energy demands due to electrification of heat and transport [9]. Energy transition through the active development of renewable energy sources aims to reduce dependence on fossil fuels and lessen ecological impacts [10]. As the UK is transitioning to net zero, how these efforts are impacting patterns of current DC in the UK is unclear.
1.1.1 Heat Pump Adoption
The goal set by the Climate Change Committee (CCC) as part of striving toward net zero was to have 10% of homes heated with HPs by 2030 [3]. However, currently, the level of residential HP adoption in the UK is only 1% [3]. Occupant behaviour is a critical area of research for informing the design of effective energy efficiency interventions and evidence-based policies within the residential sector [6]. However, a survey in Hope Valley, only 16% expressed interest in installing HPs [4]. To meet ambitious climate goals by 2050, quick and effective heat decarbonisation is essential, and one strategy is the usage of HPs where possible [9].
There are many barriers to installing HPs in current residential housing in the UK, as HPs only improve energy consumption in electric heating systems [1]. Nearly 24 million residents in the UK live in homes that use gas boilers, which are responsible for 37% of the country's carbon emissions [9]. Only 55,000 HPs were installed in UK residences in 2021, which is a lower deployment of HPs per capita than made in large European nations like France, Italy and Germany [2]. Since a majority of existing housing in the UK uses older fossil fuel technology, these residences would have to be updated to electric heat in order to take advantage of HPs [1], [7]. While new residences may be built with electric heat so as to be able to utilise HPs, in order to do this, the expertise for installing such HPs would need to be available [1], [7]. Currently, patterns of actual HP installation and usage in the UK, and how this impacts DC is not clear.
1.1.2 Domestic Photovoltaic (Solar Panel) Adoption
In the transition toward a sustainable energy future, solar energy—particularly PV technology—plays a vital role [11]. Solar PV panels on the roofs of buildings allow electricity to be generated without taking the land for other uses [4]. A typical 4 kilowatt (kW) system produces about 3,400 kilowatt hours (KWh) annually, which would meet the electricity demand of a three-bedroom domestic household [4]. Since 2010, it is estimated that more than 180 million off-grid solar systems have been installed worldwide, including around 30 million solar home systems [12]. Supportive policies have been instrumental in advancing distributed energy systems (DES) [12]. Implementation of residential and industrial solar PV is part of the UK’s net zero strategy [1]. Domestic solar PV options are popular in the UK, in that results from a survey in Hope Valley showed that 90% of respondents were in favour of solar generation on houses and non-domestic roofs, with 18% having already installed solar panels and 20% considering them [4].
To that end, the UK has implemented a Public Sector Decarbonisation Scheme which provided over £1 billion in grants over 2020 through 2022 that could be used for adding solar PV [1]. However, a clear roadmap for solar deployment is lacking, even though solar capacity is expected to grow fivefold by 2030 [2]. There is currently no target to make rooftop solar a standard for buildings across the UK [2]. A mixed-methods study of adoption of solar PV residentially in the UK was completed, and this effort was found to have actually exacerbated existing inequities [8]. Large, wealthy families often reside in modern, energy-efficient homes, but still tend to consume high amounts of energy due to their overall lifestyle and greater usage needs [6]. Research also shows that wealthy homeowners were more likely to have solar PV installed than those who were council tenants, even though many council tenants participated in solar granting programs [8]. Even so, the fact that certain residences are more suitable for solar PV than others was also a source of inequity, and authors recommended that the UK address this with policy [8]. Given this pattern of adoption of solar PV in the UK, its current impact on patterns of DC is not known.
1.1.3 Electric Vehicle Adoption
Global carbon emissions in 2019 totalled 37 gigatonnes (Gt), with road transport contributing 16% [13]. Passenger cars are the largest source of road transport emissions, making them a key target for reducing global GHG emissions [13]. Although EVs are being promoted as a sustainable alternative through the net zero policies put forth by the UK government, operation and maintenance of an EV requires a significant amount of energy [1], [14]. Wider adoption of EVs is expected to add stress to the power grid, although there are challenges to adoption in some areas, including drivers experiencing range anxiety in response to a lack of necessary infrastructure [8], [14].
The UK government acknowledges that a charging infrastructure is needed to support EV adoption which must focus on supporting local on-street residential charging [1]. In a survey from Hope Valley, 11% of respondents reported having an EV, with 39% saying they are considering buying one in the next four to five years [4]. In 2021, it was estimated that over one million EVs had been registered in the UK, and more than one in five new cars sold were EVs [1], [2]. For the first time in the UK, in 2022, sales of EVs eclipsed those of diesel vehicles, making up nearly 17% of the market [15]. However, it is unknown how the current use of EVs in the UK impacts patterns of DC.
1.2. Domestic Future Energy Scenario (DFES) Data
In the UK, to forecast future energy demand, the Northern Powergrid has implemented the Distribution Future Energy Scenarios (DFES) project [5]. The Northern Powergrid refers to the collection of primary energy stations and substations serving eight million residents across almost four million homes and businesses located in the UK’s North East, Yorkshire and northern Lincolnshire regions [16]. Primary substations (PSs) directly feed from high voltage networks, and typically step down the voltage from 33 to 11 kilovolts (kV) [17]. PSs are a crucial part of the UK energy distribution network, enabling homes and businesses to use electrical devices [17].
Much data have been collected in the DFES project to support the development of future forecasts, and these data have been posted for reuse to an open data portal [18]. DFES consists of data models that explore various pathways toward a net zero future in the region [18]. The intention of this analysis was not to forecast future energy use, but to characterise patterns of current HP, solar PV, and EV use, and how these patterns are associated with current DC. The most recent original data collected by DFES available for this analysis was from 2022, and included information about regions served by each PS, DC by these regions, and HP, solar PV, and EV ownership by these regions. These data were used for the current project.
1.3. Research Aims
Using the DFES data estimated from PSs in 2022, this paper aims to answer the following research questions about the Northern Powergrid: 1) What are the patterns of DC? and 2) How are these DC patterns related to the use of energy conserving practices promoted through the UK governments net zero strategy, which include HPs, domestic solar PVs, and EVs?
2. Methods
The following variables from the DFES data for areas served by PSs from 2022 were analysed: Number of registered plug-in EVs (pure and hybrid), number of HPs per residential household and commercial properties, domestic PV installed capacity for installations less than 4kW, and DC in megawatt hours (MWh) excluding EV and HP consumption [18]. After descriptive and geographic analyses to assess patterns of DC were conducted, separate Pearson correlations were developed with number of EVs, HPs, and domestic PV as independent variables, and DC as the dependent variable. To better understand relative contributions of the independent variables to DC, a linear regression analysis was done with DC as the dependent variable and the others as independent variables; covariates were retained in the model if their slopes were statistically significant (α = 0.05).
3. Results
The original DFES dataset contained data for 545 primary substations; four were removed due to missing data, and the other 541 were used in analysis. Table 1 summarises the descriptive results.
Table 1. Summary Statistics
|
|
|
|
|
Domestic Consumption |
|
|
Category |
Levels |
Median (IQR) |
All |
Above Median |
Below Median |
|
All |
All |
N/A |
541, 100% |
270, 50% |
271, 50% |
|
Number of electric vehicles |
0 to 49 |
112 (58-185) |
110, 20% |
2, 1% |
108, 40% |
|
|
50 to 99 |
|
124, 23% |
38, 14% |
86, 32% |
|
|
100 to 149 |
|
109, 20% |
75, 28% |
34, 13% |
|
|
150 to 199 |
|
79, 15% |
61, 23% |
18, 7% |
|
|
200 and more |
|
119, 22% |
94, 35% |
25, 9% |
|
Number of heat pumps |
0 to 99 |
71 (34-129) |
352, 65% |
104, 39% |
248, 92% |
|
|
100 to 199 |
|
146, 27% |
124, 46% |
22, 8% |
|
|
200 or more |
|
43, 8% |
42, 16% |
1, 0% |
|
Domestic photovoltaic installed capacity (kW) |
0 to <1 kW |
0.75 (0.35-1.22) |
341, 63% |
102, 38% |
239, 88% |
|
|
1 kW to < 2 kW |
|
157, 29% |
126, 47% |
31, 11% |
|
|
2 kW and higher |
|
43, 8% |
42, 16% |
1, 0% |
|
Domestic underlying energy consumption (MWh)* |
0 to <20,000 MWh |
18,053.00 (9,169.60-28,006.60) |
302, 56% |
31, 11% |
271, 100% |
|
|
20,000 MWh to < 40,000 MWh |
|
212, 39% |
212, 79% |
0, 0% |
|
|
40,000 MWh and higher |
|
27, 5% |
27, 10% |
0, 0% |
* Excludes electric vehicle and heat pump consumption. IQR = Interquartile range. N/A = not applicable.
As shown in Table 1, the greatest percentage of PS service areas (n = 124, 23%) had a density of 50 to 99 EVs, while the second greatest percentage had 200 or more (n = 119, 22%). However, when classified by DC, 35% (n = 94) of PS service areas above the median in DC had a density of EVs of 200 or more, compared to only 9% (n = 25) of PS service areas below the median in DC. A similar pattern was seen with HPs, where overall, 65% (n = 352) of the PS service areas had 0 to 99 HPs, but when classified by DC, only 39% (n = 104) of PS service areas above the median in DC fell in this category of low density of HPs compared to 92% (n = 248) among PS service areas with DC below the median. In PS service areas where HPs numbered 200 or more, 16% (n = 42) of PS service areas with DC above the median fell in this category, while only one PS service area below the median in DC fell in this category. In terms of solar PV capacity, with respect to the lowest category (0 to <1 kW), 38% (n = 102) of PS service areas where DC was above the median fell in this category, while far more (88%, n = 239) of PS service areas where DC was below the median fell in this category. By contrast, in the highest class of solar PV capacity (2 kW and higher), 16% (n = 42) of the PS service areas with DC above the median fell in this category, while only one PS service area where DC was below the median fell in this category.
3.1. Geographic Patterns of Domestic Energy Consumption
Figure 1 shows geographic patterns of DC by areas served by PSs.
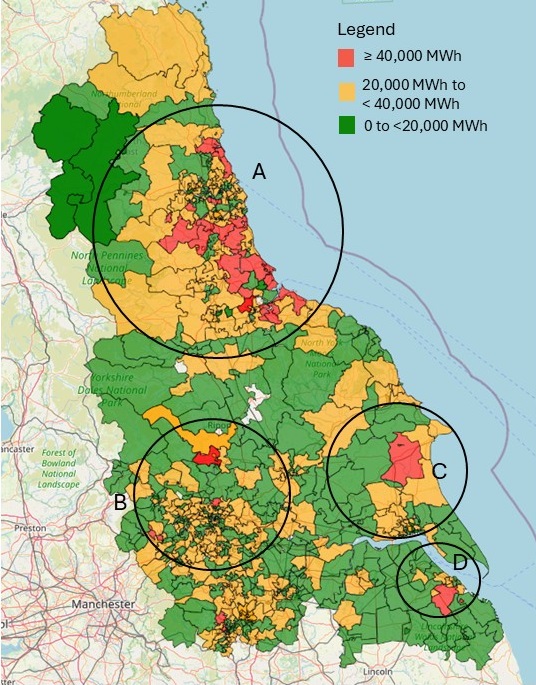
Mwh = Megawatt hours of consumption excluding electric vehicle and head pump, A = Newcastle upon Tyne area, B = Leeds and Bradford area, C = Feeds Hull area (south), D = Feeds Grimsby area (north).
As shown in Figure 1, DC was highest in the more populated areas of Newcastle upon Tyne, Leeds and Bradford, Feeds Hull, and Feeds Grimsby. Among these, more PS service areas were in the highest DC category in the more affluent areas of Newcastle upon Tyne and Leeds and Bradford (A and B on Figure 1).
3.2. Patterns in Use of Heat Pumps, Solar Photovoltaic, Electric Vehicles and Domestic Energy Consumption
There were statistically significant positive correlations between number of HPs and DC (r = 0.7533), solar PV and DC (r = 0.6937), and EVs and DC (r = 0.3246, p < 0.0001 for all). Because EVs had a skewed distribution (see Table 1), Figure 2 was developed to help interpret the association of both EV and HPs with DC simultaneously.
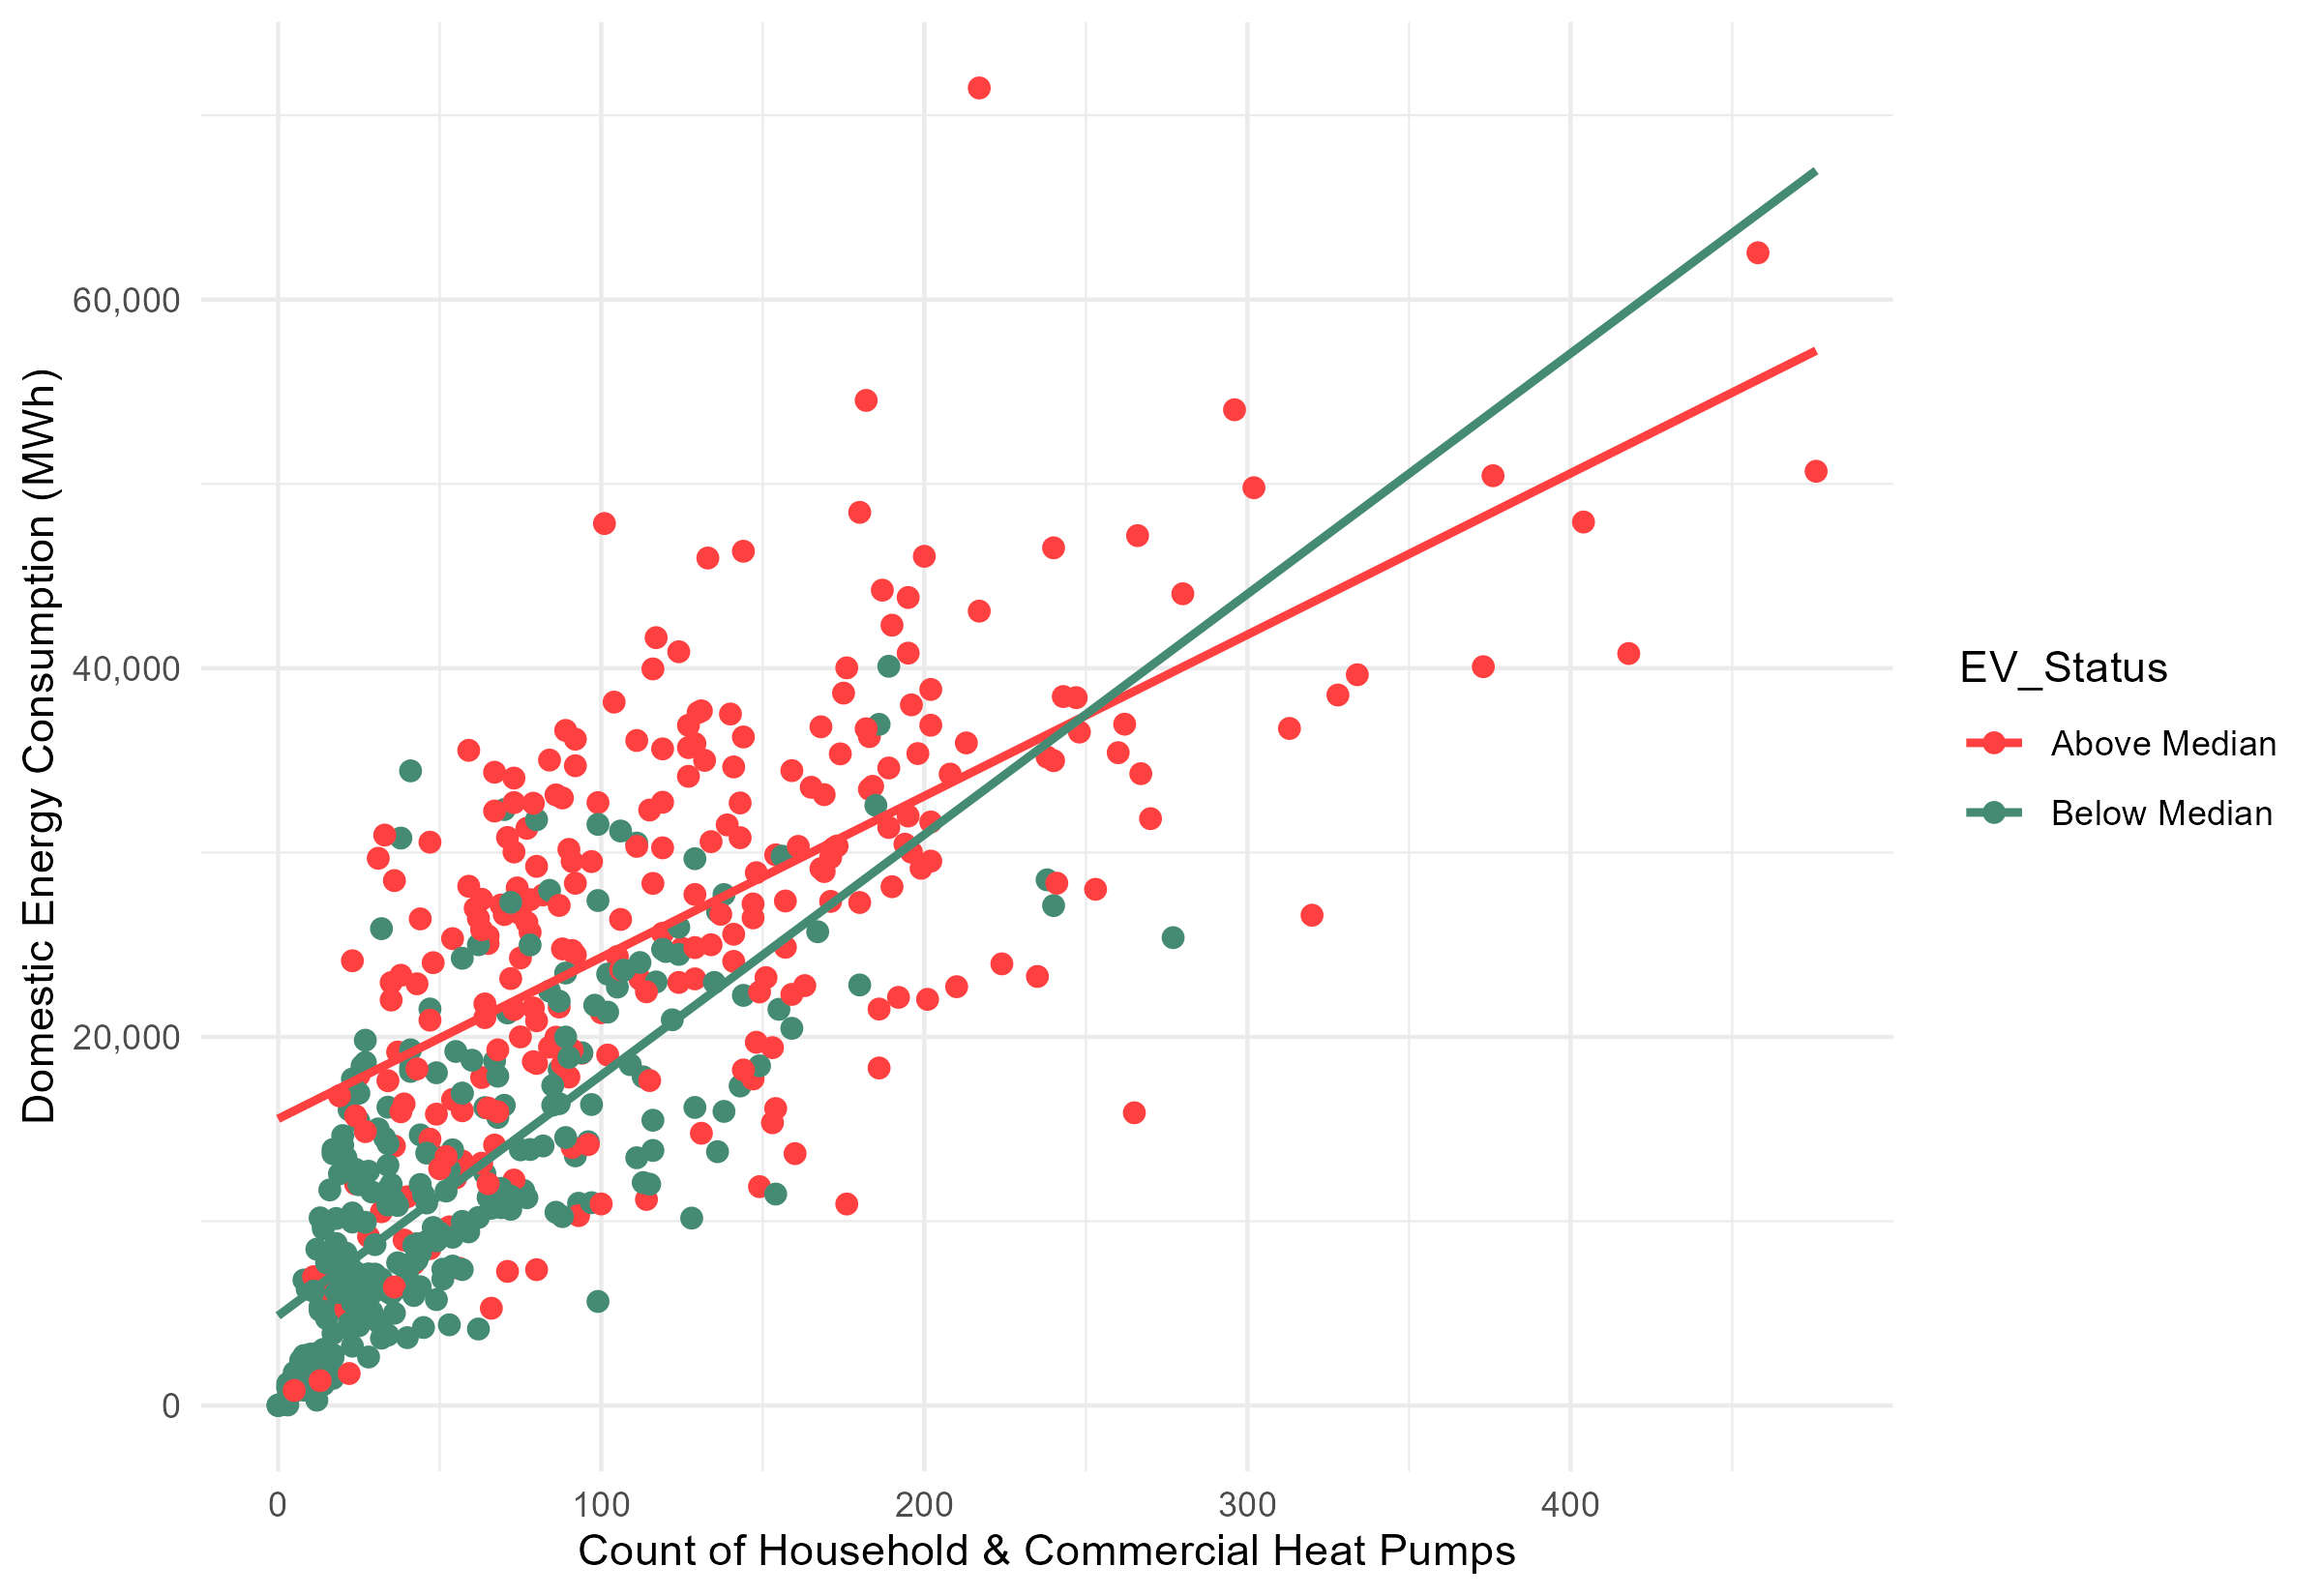
MWh = megawatt hours, EV = Electric vehicles.
In Figure 2, number of HPs is on the x axis, and DC is on the y-axis. Each dot in the scatter plot represents a PS service area; grey dots represent PS service areas where EV count is below the median and orange dots represent PS service areas where EV count is above the median (least square lines are included for each group). The figure suggests a general trend of where DC is low, both HPs and EVs are unpopular, and where DC is high, both HPs and EVs are more plentiful.
For linear regression, the slope for solar PV was not statistically significant, so was not retained in the model. The final model equation presented in Eq. 1 was:

Where ŷ is estimated DC, x1 is number of HPs, and x2 is number of EVs (F = 415.2 on 2 and 538 df, p < 0.0001, adjusted r2 = 0.6054).
3. Discussion
In terms of patterns of DC in PS service areas of the Northern Powergrid, higher DC was identified in four main areas which were more densely populated: The Newcastle upon Tyne area, the Leeds and Bradford area, the Feeds Hull area (south), and the Feeds Grimsby area (north). The most PS service areas with the highest DC were seen in the more affluent areas of Newcastle upon Tyne and Leeds and Bradford. DC was also highest in areas with greater numbers of EVs, more HPs, and more solar PV capacity. These findings suggest that DC is highest where the population is already adopting the use of EVs, HPs, and residential solar panels, and this is taking place in more densely populated urban areas.
Our analysis showed that in areas where there was low DC, there were also low levels of EV ownership and low usage of HPs, and that DC appears to be driven by EV and HP use. While it may be logical to increase the use of EVs and HPs where DC is highest so as to mitigate stress on the electric grid, non-adoption of EVs and HPs in any region in the UK provides barriers to reaching net zero goals [1]. In order to promote use adoption of EVs and HPs in lower DC areas, targeted strategies must be put in place.
Inequity and lack of energy justice has already been studied with respect to the adoption of residential solar PV in the UK [8]. The study found that non-homeowners without access to roofs faced barriers to establishing residential solar PV [8]. It was found that lack of infrastructure and subsidisation of energy costs that burden the poor also provided barriers, as did a culture that embeds fossil fuel use and lack of rural access [8].
A similar inequity has been identified with respect to EV ownership, where one study found that the mean monthly income in the UK of EV users was £600 greater than for those owning fossil fuel cars [19]. The same study found that only 14% of EV owners were classified as Rural Residents, while 22% were classified as Urbanites and another 25% were classified as Suburbanites [19]. Another study of EV charging scenarios in areas in rural UK suggest that charging will be supported by lower tariffs, and if tariffs are kept low, it will likely not negatively impact the electrical grid in these areas [20]. A survey in rural UK found that 37% of respondents said it was very unlikely that their next vehicle would be an EV, and reasons suggested were lack of public charging infrastructure, lack of home access to charge points, and lack of awareness of reduced charging tariffs when charging in early hours (midnight to 6:00 am) [21].
In terms of HP adoption, a study that included a national survey in the UK found that there were three major barriers to HP adoption in the UK [22]. First, before homes can qualify for governmental subsidies for HP installation, they must be made “HP ready”, such as adding new radiators and additional pipework, and many homeowners do not have the capacity to do this [22]. Second, interviews with HP installers found that they themselves do not have the capacity to conduct the renovations in order to make homes HP ready [22]. Finally, the national survey found that homeowners were unaware of the renovations needed to make their homes HP ready, and were unwilling to spend money on this unless subsidised by the government [22]. In this way, inequity in the form of lack of ability to pay for renovations to make homes HP ready provide a barriers to HP adoption in low DC areas [4], [22].
3.1. Potential Solutions
Optimising energy strategies and prioritising the expansion of renewable energy are crucial for the UK to reduce environmental impacts and advance sustainable development [10]. In addition, equitable access to affordable and reliable modern energy services is a fundamental component of sustainable development, ensuring that all communities can benefit from the energy transition [23]. One approach the UK government could use to promote achieving net zero is to strengthen policy support for renewable energy adoption by setting clear development targets, and encouraging both enterprises and residents to increase their use of renewables through measures such as financial subsidies and tax incentives [10]. Evidence suggests that increases in renewable energy use and financial development contribute to reducing carbon emissions, while rising domestic material consumption and GHG emissions continue to undermine environmental quality [24]. To address this, it is essential to reduce GHG emissions and accelerate the replacement of non-renewable energy sources with renewable alternatives [11]. A critical part of this effort is developing robust metrics to accurately measure the carbon footprint of electricity consumption and production [25]. As renewable energy continues to make up a larger share of the power grid, institutional “100% renewable energy” targets should adopt hourly accounting to more precisely assess carbon emissions reductions—since the actual impact depends on the timing and alignment of energy use with renewable availability [25].
Energy is a fundamental driver of modern infrastructure and progress [12]. Every aspect of life—households, industry, transportation, agriculture, healthcare, education, and entertainment—is becoming increasingly reliant on a stable and accessible energy supply [12]. As residents change from less to more sustainable energy usage approaches, energy demand will be impacted [4]. Notably, a one-percentage-point increase in energy transition implementation is associated with a 0.152% reduction in carbon emissions [10]. This highlights the important role of the energy transition in directly lowering carbon emissions and contributing to improved environmental outcomes [10]. Projections indicate that electricity consumption from renewable energy sources will rise by two-thirds between 2020 and 2030, ultimately accounting for nearly 80% of global electricity demand [11]. Future renewable energy systems are expected to revolve around renewable electricity as the primary final energy carrier [26]. This electricity will be converted into various forms of useful energy through technologies such as HPs and EVs [26]. EVs are cheaper to use and maintain than traditional petrol and diesel vehicles, and energy efficiency measures in residential homes will substantially lower people's heating costs [1], [2]. HPs may be more economical in the long run than gas boilers, depending on a range of factors [2]. Many groups therefore develop models and algorithms to forecast future demand [14], [27] [14], [26], [27], [28]. Energy system modelling is playing an increasingly vital role in analysing energy scenarios and understanding their implications for infrastructure, policy, and society [26].
This analysis has both strengths and limitations. A strength is that it leverages real-world open data from DFES to understand progress toward the implementation of sustainable energy strategies in the UK. While the results provide a picture of current progress, the project was limited to the variables from DFES that were available for analysis. There are likely many other influences on DC that were not accounted for in the analysis, and this is another limitation.
5. Conclusion
In this analysis of 2022 data covering PS service areas in the Northern Powergrid, DC was highest in more densely-populated and affluent regions. Use of HPs and EVs were strongly directly associated with DC. The association between number of HPs and DC was likely due to the fact that HPs can only be installed in residences with electric heat, and those are more likely to be in more affluent areas and areas with higher population levels which include newer residences. The association between number of EVs and DC was likely a reflection of the underlying EV infrastructure, which is much more developed in affluent areas and areas with higher population levels.
The findings from this analysis suggest that in less-populated areas of the Northern Powergrid where DC is low, HPs and EVs will face barriers to adoption. These areas contain older residences that will require an upgrade of their heating systems before being suitable for HPs, and research suggests that this will not happen without government subsidies [22]. Further, EV infrastructure such as charging stations must be developed in these low DC areas, and tariff charges much be kept low in order for residents to be willing to give up cars using fossil fuel and adopt EVs [21]. These findings underscore the challenges behind the UK’s net zero strategy, in that without governmental investment in making residences HP ready and improving the rural EV charging infrastructure, continuing to pursue these strategies may exacerbate rather than alleviate inequities [1], [8], [21], [22].
References
[1] HM Government, “Net Zero Strategy: Build Back Greener,” Energy White Paper ISBN 978-1-5286-2938-6, Oct. 2021.
[2] C. Skidmore, “Mission Zero: Independent Review of Net Zero,” Net Zero Review Team, Jan. 2023. [Online]. Available: https://www.gov.uk/government/publications/review-of-net-zero
[3] G. Colverd, R. Bardhan, and J. Cullen, “Benchmarking domestic energy consumption using high-resolution neighbourhood energy data and city clustering in the UK,” in Proceedings of the 11th ACM International Conference on Systems for Energy-Efficient Buildings, Cities, and Transportation, in BuildSys ’24. New York, NY, USA: Association for Computing Machinery, Oct. 2024, pp. 121–131. doi: 10.1145/3671127.3698183. View Article
[4] S. Platt and D. Ward, “Hope Valley Energy and Renewables,” Hope Valley Climate Action Energy Group, May 2022.
[5] Northern Powergrid, “Distribution future energy scenarios: Mapping net zero locally,” 2023. Accessed: Nov. 26, 2024. [Online]. Available: View Article
[6] H. Ben and K. Steemers, “Household archetypes and behavioural patterns in UK domestic energy use,” Energy Effic., vol. 11, no. 3, pp. 761–771, Mar. 2018, doi: 10.1007/s12053-017-9609-1. View Article
[7] Heat Pump Association, “Building the Installer Base for Net Zero Heating,” Jun. 2020. [Online]. Available: View Article
[8] B. K. Sovacool, M. L. Barnacle, A. Smith, and M. C. Brisbois, “Towards improved solar energy justice: Exploring the complex inequities of household adoption of photovoltaic panels,” Energy Policy, vol. 164, pp. 1–13, May 2022, doi: 10.1016/j.enpol.2022.112868. View Article
[9] Y. Wang, J. Wang, and W. He, “Development of efficient, flexible and affordable heat pumps for supporting heat and power decarbonisation in the UK and beyond: Review and perspectives,” Renew. Sustain. Energy Rev., vol. 154, pp. 1–25, Feb. 2022, doi: 10.1016/j.rser.2021.111747. View Article
[10] Q. Wang, X. Wang, and R. Li, “Energy transition and environmental sustainability: the interplay with natural resource rents and trade openness,” Humanit. Soc. Sci. Commun., vol. 12, no. 1, p. 1152, Jul. 2025, doi: 10.1057/s41599-025-05521-4. View Article
[11] A. D. A. Bin Abu Sofian, H. R. Lim, H. Siti Halimatul Munawaroh, Z. Ma, K. W. Chew, and P. L. Show, “Machine learning and the renewable energy revolution: Exploring solar and wind energy solutions for a sustainable future including innovations in energy storage,” Sustain. Dev., vol. 32, no. 4, pp. 3953–3978, 2024, doi: 10.1002/sd.2885. View Article
[12] T. B. Nadeem, M. Siddiqui, M. Khalid, and M. Asif, “Distributed energy systems: A review of classification, technologies, applications, and policies,” Energy Strategy Rev., vol. 48, p. 101096, Jul. 2023, doi: 10.1016/j.esr.2023.101096. View Article
[13] J. Nieto, P. E. Brockway, M. Sakai, and J. Barrett, “Assessing the energy and socio-macroeconomic impacts of the EV transition: A UK case study 2020–2050,” Appl. Energy, vol. 370, pp. 1–15, Sep. 2024, doi: 10.1016/j.apenergy.2024.123367. View Article
[14] K. C. Akshay, G. H. Grace, K. Gunasekaran, and R. Samikannu, “Power consumption prediction for electric vehicle charging stations and forecasting income,” Sci. Rep., vol. 14, no. 1, p. 6497, Mar. 2024, doi: 10.1038/s41598-024-56507-2. View Article
[15] I. S. Bayram, A. Saad, R. Sims, A. Babu, C. Edmunds, and S. Galloway, “Statistical characterization of public AC EV chargers in the UK,” IEEE Access, vol. 11, pp. 70274–70287, 2023, doi: 10.1109/ACCESS.2023.3293091. View Article
[16] Northern Powergrid, “About Us,” Northern Powergrid. Accessed: Dec. 04, 2024. [Online]. Available: View Article
[17] Y. Zhou, C. Essayeh, and T. Morstyn, “Datasets of Great Britain primary substations integrated with household heating information,” Data Brief, vol. 54, pp. 1–16, Jun. 2024, doi: 10.1016/j.dib.2024.110483. View Article
[18] Data Mill North, “Distribution Future Energy Scenarios - DFES 2023.” 2024. Accessed: Aug. 24, 2024. [Online]. Available: View Article
[19] R. Lee and S. Brown, “Evaluating the role of behavior and social class in electric vehicle adoption and charging demands,” iScience, vol. 24, no. 8, p. 102914, Jul. 2021, doi: 10.1016/j.isci.2021.102914. View Article
[20] T. R. McKinney, E. E. F. Ballantyne, and D. A. Stone, “Rural EV charging: The effects of charging behaviour and electricity tariffs,” Energy Rep., vol. 9, pp. 2321–2334, Dec. 2023, doi: 10.1016/j.egyr.2023.01.056. View Article
[21] T. R. McKinney, E. E. F. Ballantyne, and D. A. Stone, “Understanding the rural demographics need for electric vehicles,” Int. J. Logist. Res. Appl., pp. 1–18, 2025, doi: 10.1080/13675567.2025.2475938. View Article
[22] N. Lamb and D. Elmes, “Increasing heat pump adoption: analysing multiple perspectives on preparing homes for heat pumps in the UK,” Carbon Neutrality, vol. 3, no. 1, p. 10, Apr. 2024, doi: 10.1007/s43979-024-00084-w. View Article
[23] S. Sigurgeirsdóttir, “Sustainable energy development: History of the concept and emerging themes,” Renew. Sustain. Energy Rev., May 2021, doi: 10.1016/J.RSER.2021.110770. View Article
[24] O. Usman, A. A. Alola, and S. S. Akadiri, “Effects of domestic material consumption, renewable energy, and financial development on environmental sustainability in the EU-28: Evidence from a GMM panel-VAR,” Renew. Energy, vol. 184, pp. 239–251, Jan. 2022, doi: 10.1016/j.renene.2021.11.086. View Article
[25] J. A. De Chalendar and S. M. Benson, “Why 100% renewable energy is not enough,” Joule, vol. 3, no. 6, pp. 1389–1393, Jun. 2019, doi: 10.1016/j.joule.2019.05.002. View Article
[26] J. Priesmann, L. Nolting, C. Kockel, and A. Praktiknjo, “Time series of useful energy consumption patterns for energy system modeling,” Sci. Data, vol. 8, no. 1, p. 148, May 2021, doi: 10.1038/s41597-021-00907-w. View Article
[27] T. van Etten, V. Degeler, and D. Luo, “Large-scale forecasting of electric vehicle charging demand using global time series modeling,” presented at the 10th International Conference on Vehicle Technology and Intelligent Transport Systems, Aug. 2024, pp. 40–51. Accessed: Aug. 15, 2024. [Online]. Available: https://www.scitepress.org/Link.aspx?doi=10.5220/0012555400003702 View Article
[28] A. Sorour, M. Fazeli, M. Monfared, A. A. Fahmy, J. R. Searle, and R. P. Lewis, “Forecast-Based Energy Management for Domestic PV-Battery Systems: A U.K. Case Study,” IEEE Access, vol. 9, pp. 58953–58965, 2021, doi: 10.1109/ACCESS.2021.3072961. View Article